

For months, TRREB has been telling us the second half of 2026 would look different. July delivered the proof — not with a surge in sales, but with a dramatic pullback in supply. Home sales held essentially steady at 5,995 (down just 0.9% from last July), while new listings collapsed 17.8% to 14,484. When demand holds and supply evaporates, the math only moves in one direction: competition.
Active homebuyers felt it. TRREB reports that buyers faced more competition from other would-be purchasers in July, and if this trend continues, average selling prices could level off in the second half of the year. On a seasonally adjusted basis, sales were actually up month-over-month compared to June, while new listings were down — market conditions tightened as the summer progressed.
July 2026 at a Glance
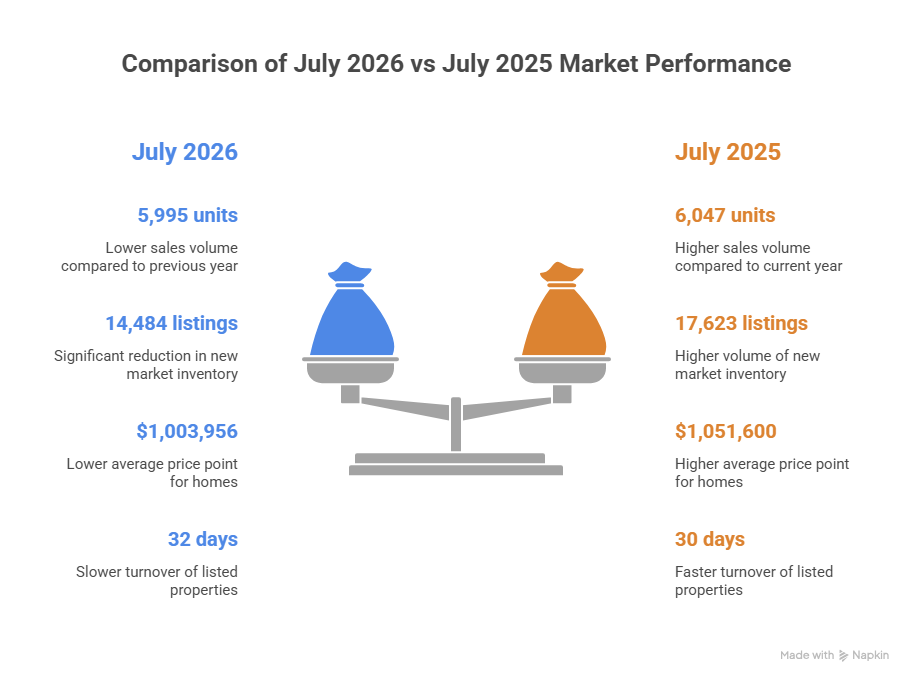
Home sales: 5,995 — down 0.9% year-over-year (July 2025: 6,047)
New listings: 14,484 — down 17.8% year-over-year (July 2025: 17,623)
Active listings: 26,098 — down 12.1% year-over-year
Average selling price: $1,003,956 — down 4.5% year-over-year (July 2025: $1,051,600)
MLS® HPI Composite: down 4.6% year-over-year
Sales-to-new-listings ratio: 41.4% — up sharply from 34.3% a year ago
Average listing days on market: 32 (vs. 30 in July 2025)
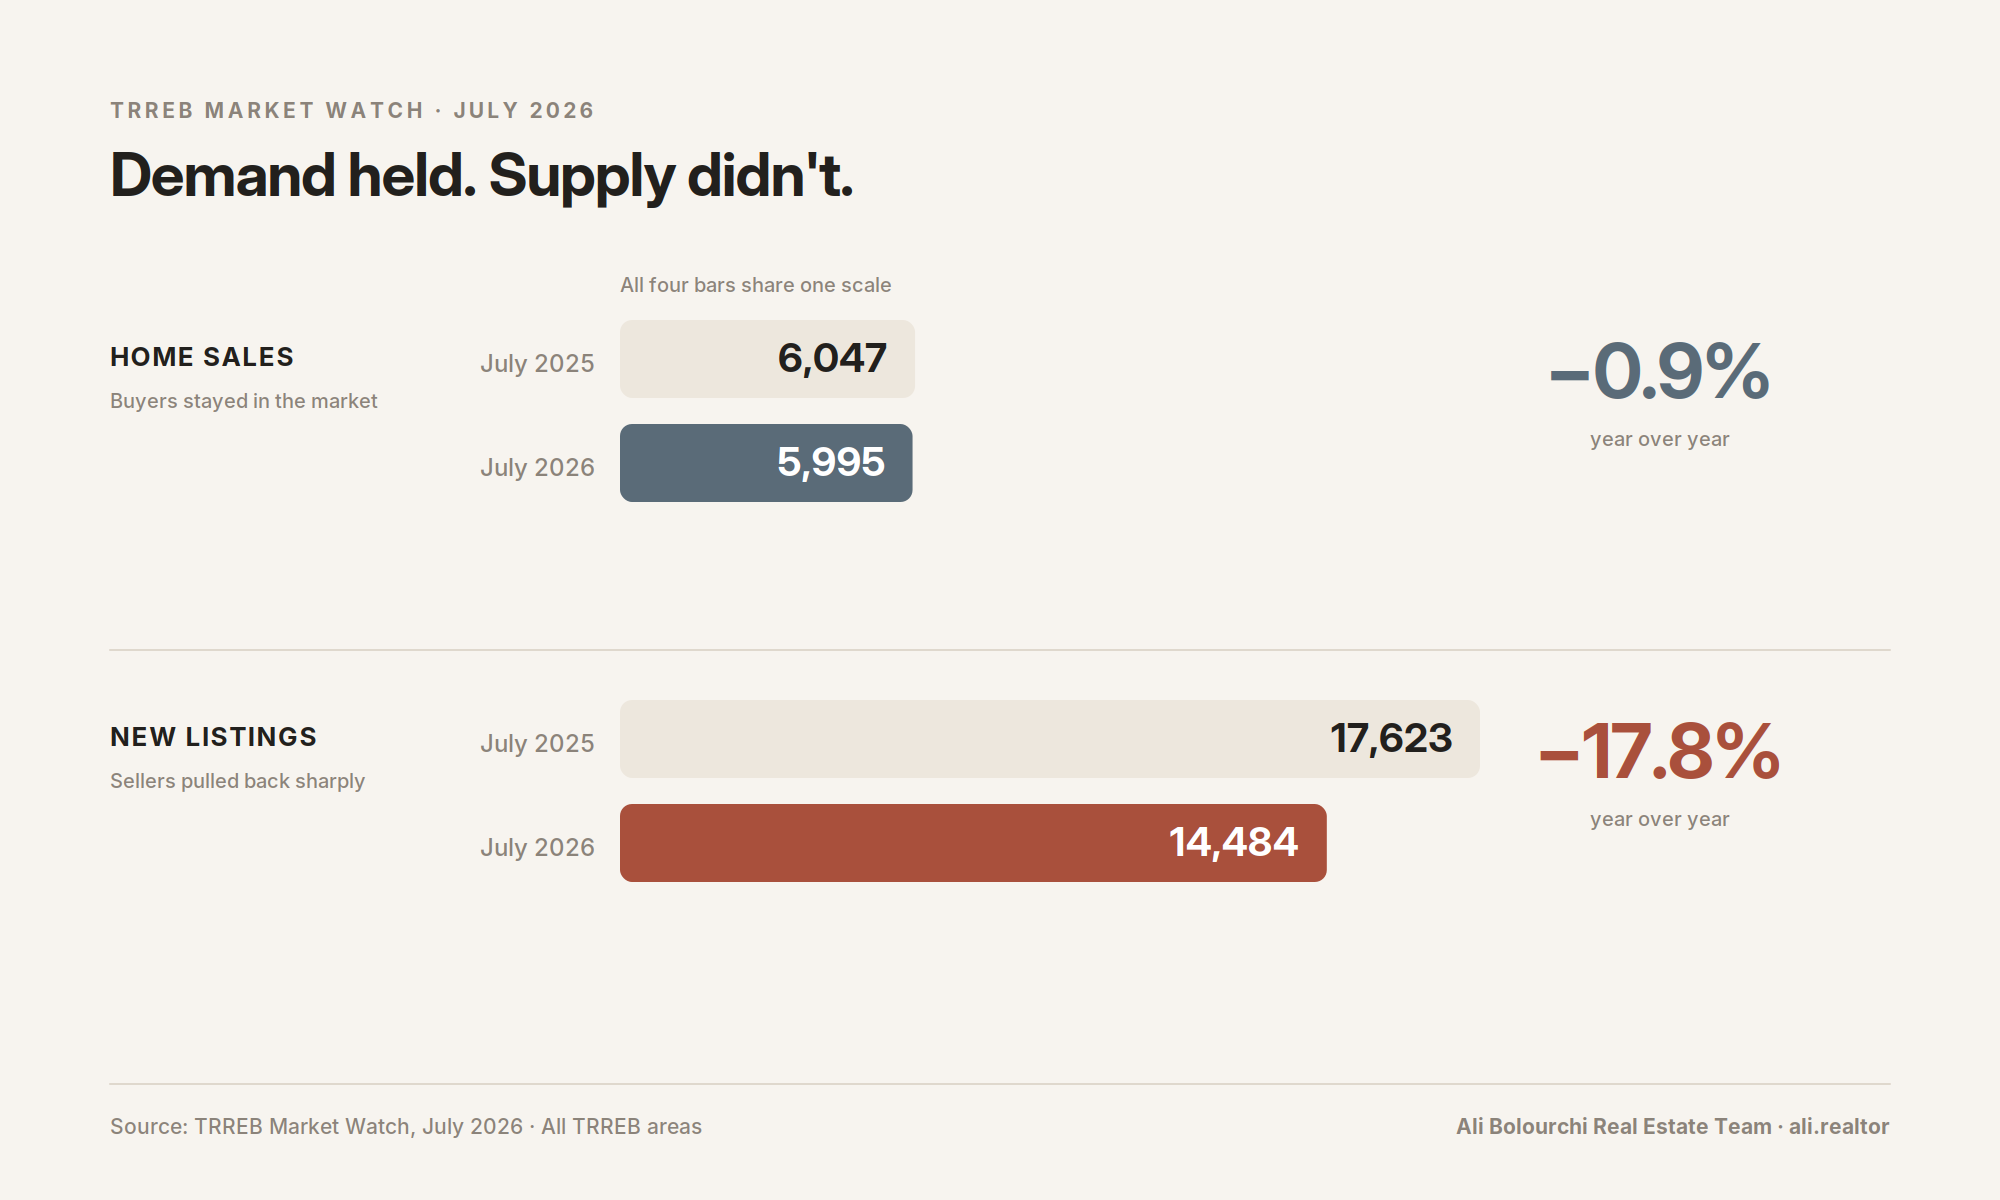
Read that sales-to-new-listings ratio again. A year ago, roughly one in three new listings found a buyer within the month. This July, it was better than two in five. That is the single clearest measure of the tightening TRREB has been forecasting — and it's why the negotiating room buyers enjoyed through 2025 is shrinking.

Detached Homes: The 416 Quietly Outperforms
Detached homes accounted for 2,789 sales — 46.5% of all GTA transactions — at an average price of $1,291,690 (down 5.1% year-over-year).
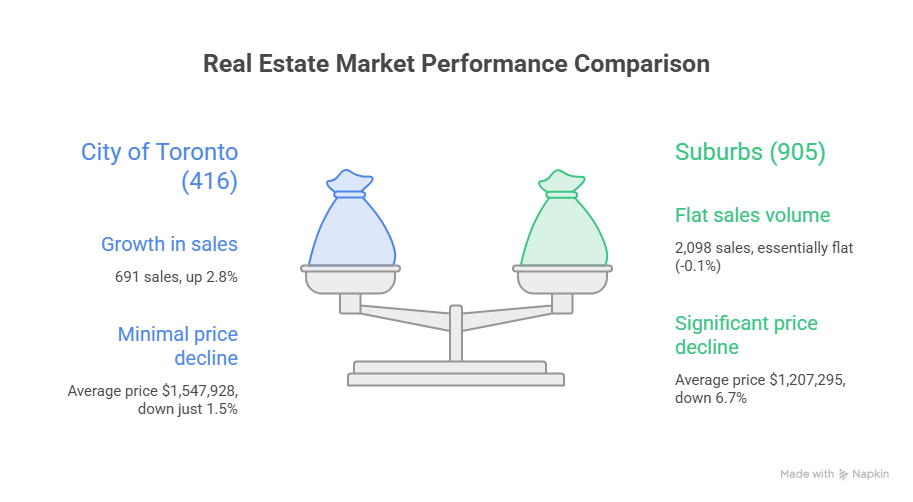
City of Toronto (416): 691 sales, up 2.8% — average price $1,547,928, down just 1.5%
Suburbs (905): 2,098 sales, essentially flat (-0.1%) — average price $1,207,295, down 6.7%
Insight: The 416/905 divergence is becoming the story of the detached market. Toronto proper posted rising sales and near-stable prices, while the 905 continued to absorb the bulk of the price adjustment. For move-up buyers eyeing the city, the discount window is narrowing faster than the headlines suggest.
Semi-Detached: July's Soft Spot
Semi-detached homes recorded 557 sales at an average price of $964,922, down 7.4% year-over-year — the largest price decline of any major home type this month.
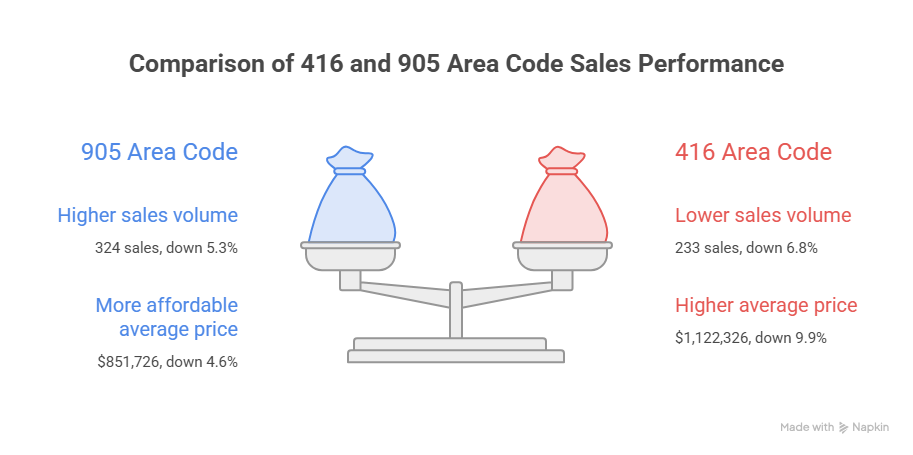
416: 233 sales, down 6.8% — average price $1,122,326, down 9.9%
905: 324 sales, down 5.3% — average price $851,726, down 4.6%
Insight: A near-10% annual price drop on Toronto semis is a genuine opportunity flag. Semis are the classic first move-up rung, and when they lag the broader market this much in a tightening supply environment, they rarely stay discounted for long.
Townhouses: Toronto Demand Jumps
Townhouses posted 1,003 sales at an average price of $817,213, down 3.9% year-over-year.
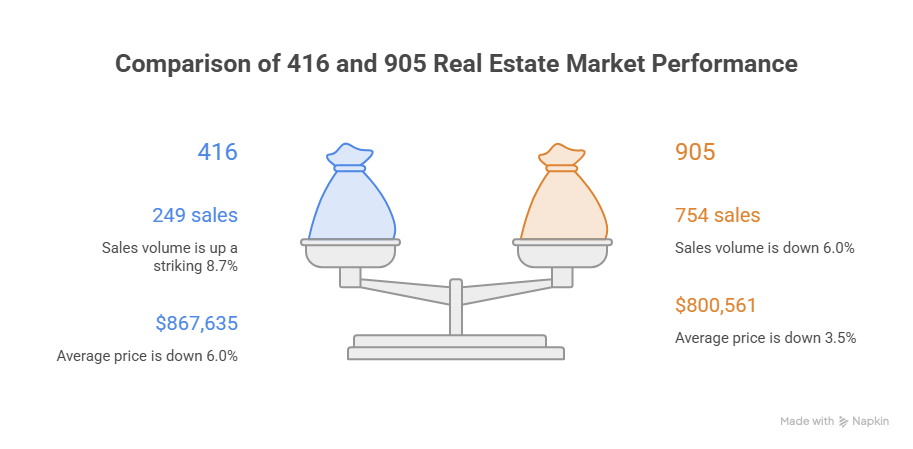
416: 249 sales, up a striking 8.7% — average price $867,635, down 6.0%
905: 754 sales, down 6.0% — average price $800,561, down 3.5%
Insight: An 8.7% sales jump in the 416 tells us affordability-driven buyers are converging on the townhouse segment — the last family-friendly format under $900K in the city. Expect this segment to firm up first if the supply squeeze persists into fall.
Condo Apartments: The Bottom Keeps Forming
Condo apartments recorded 1,564 sales — 26.1% of the market — at an average price of $636,323, down just 2.3% year-over-year.

416: 1,054 sales, up 3.3% — average price $672,807, down only 1.6%
905: 510 sales, down 6.6% — average price $560,923, down 5.0%

Insight: Six months ago, Toronto condo prices were falling at a high single-digit annual pace. In July, the decline was 1.6%. That is what a bottom looks like while it's forming: sales rising, price declines compressing toward zero. Investors waiting for a bell to ring should understand — this is the bell.
The Economic Backdrop
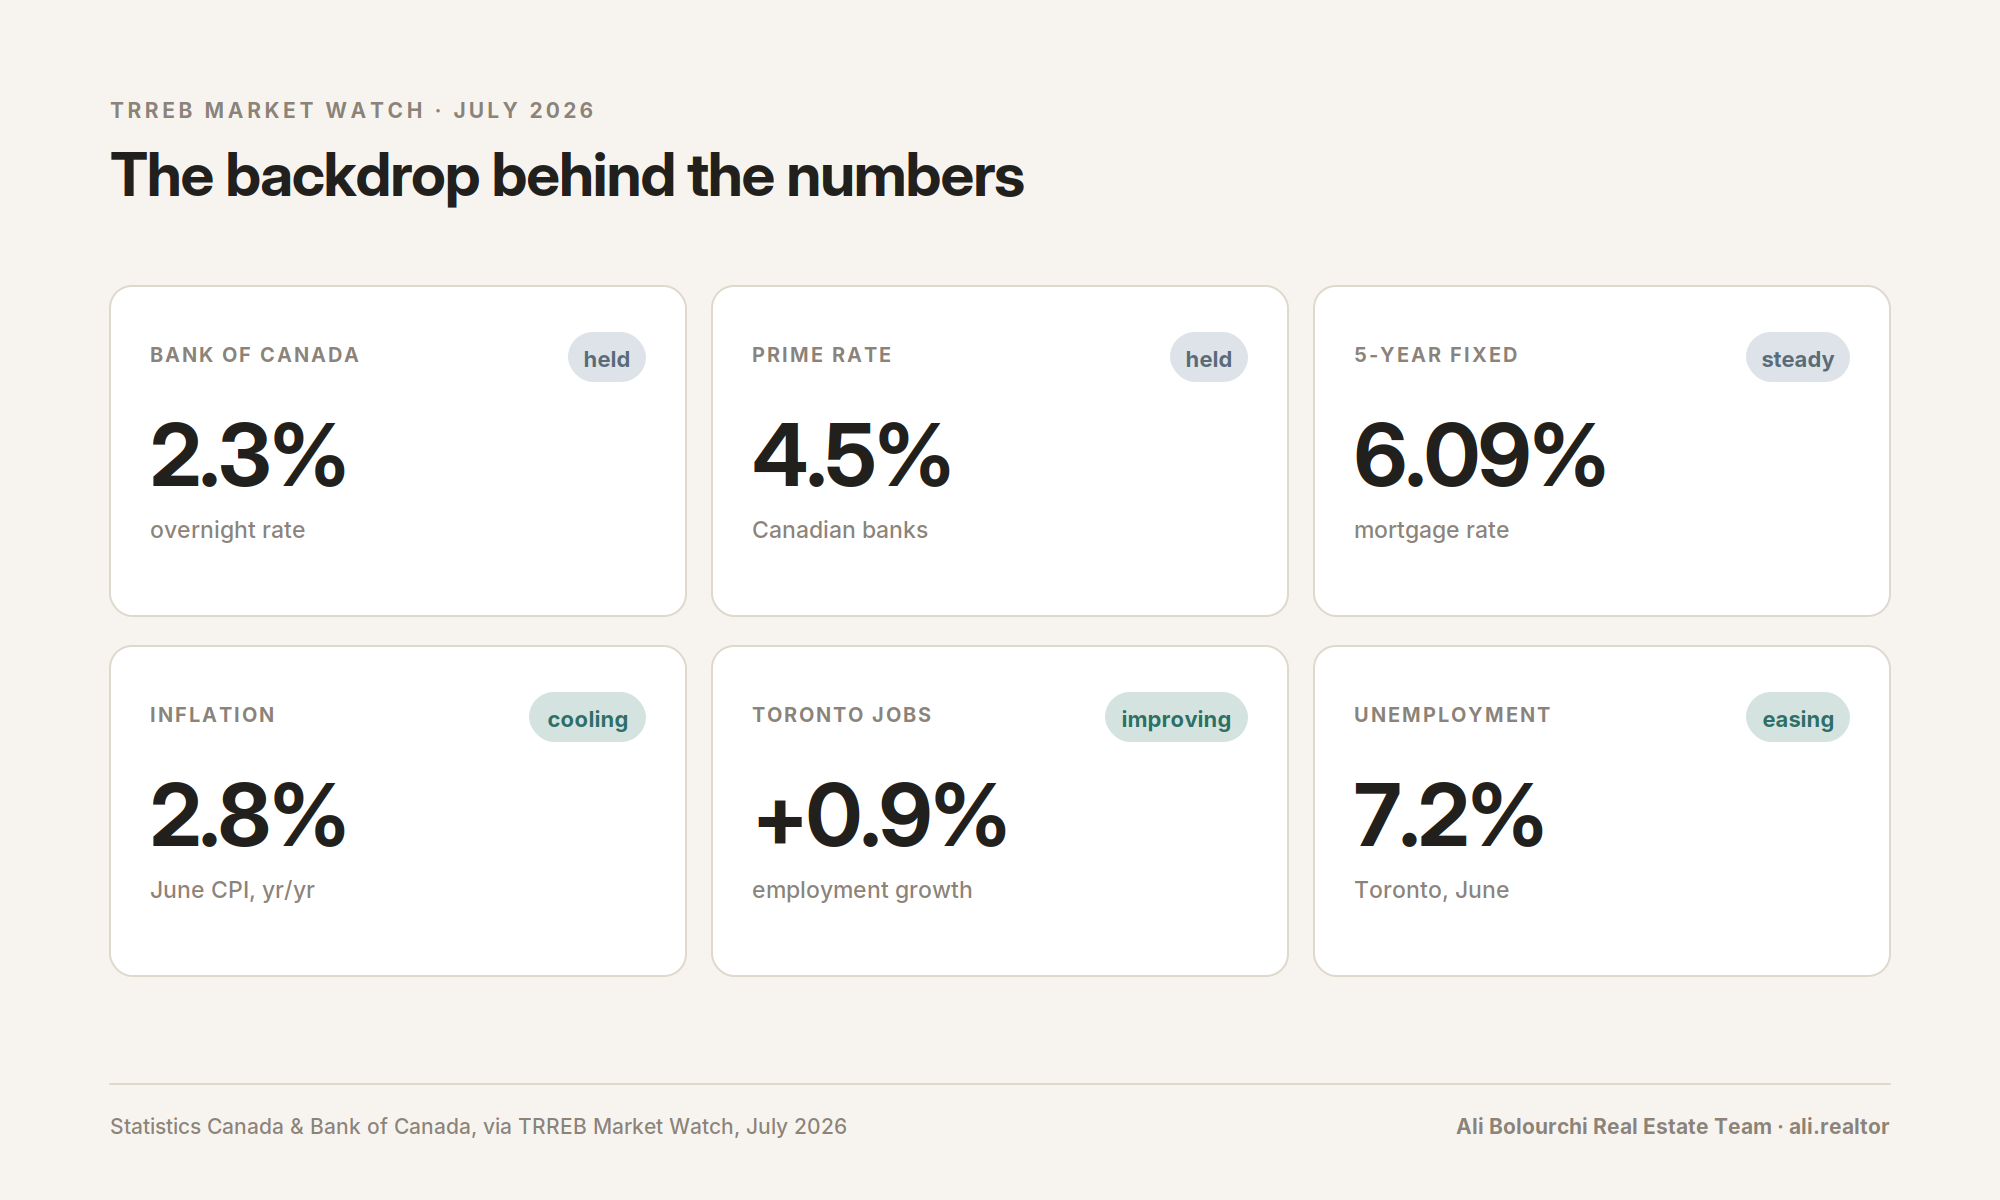
The macro picture improved more than expected. Toronto employment grew 0.9% in June and the unemployment rate eased to 7.2%. Inflation cooled to 2.8%, the Bank of Canada held its overnight rate at 2.3% (prime: 4.5%), and mortgage rates were steady — 5.49% for 1-year, 6.05% for 3-year, and 6.09% for 5-year terms.
TRREB President Daniel Steinfeld framed the tightening plainly: "With sales accounting for a larger share of listings, buyers may find there is less room to negotiate moving forward. If current trends continue, home prices could start to level off compared to last year." He noted many would-be buyers are still waiting for clarity on tariffs, inflation and borrowing costs.
Chief Information Officer Jason Mercer added a note of optimism: "The latest readings on economic growth and jobs surprised to the upside. This could help bolster consumer confidence and prompt an uptick in home purchases in the months ahead, especially if home prices stabilize as we move through the fall."
And CEO John DiMichele pointed to the policy front ahead of the municipal election: "Restrictive zoning, outdated rules, high taxes and fees, and approval delays are making housing more expensive… They add tens of thousands of dollars to the cost of every home and need to be reformed."
What This Means for You
If You're Buying
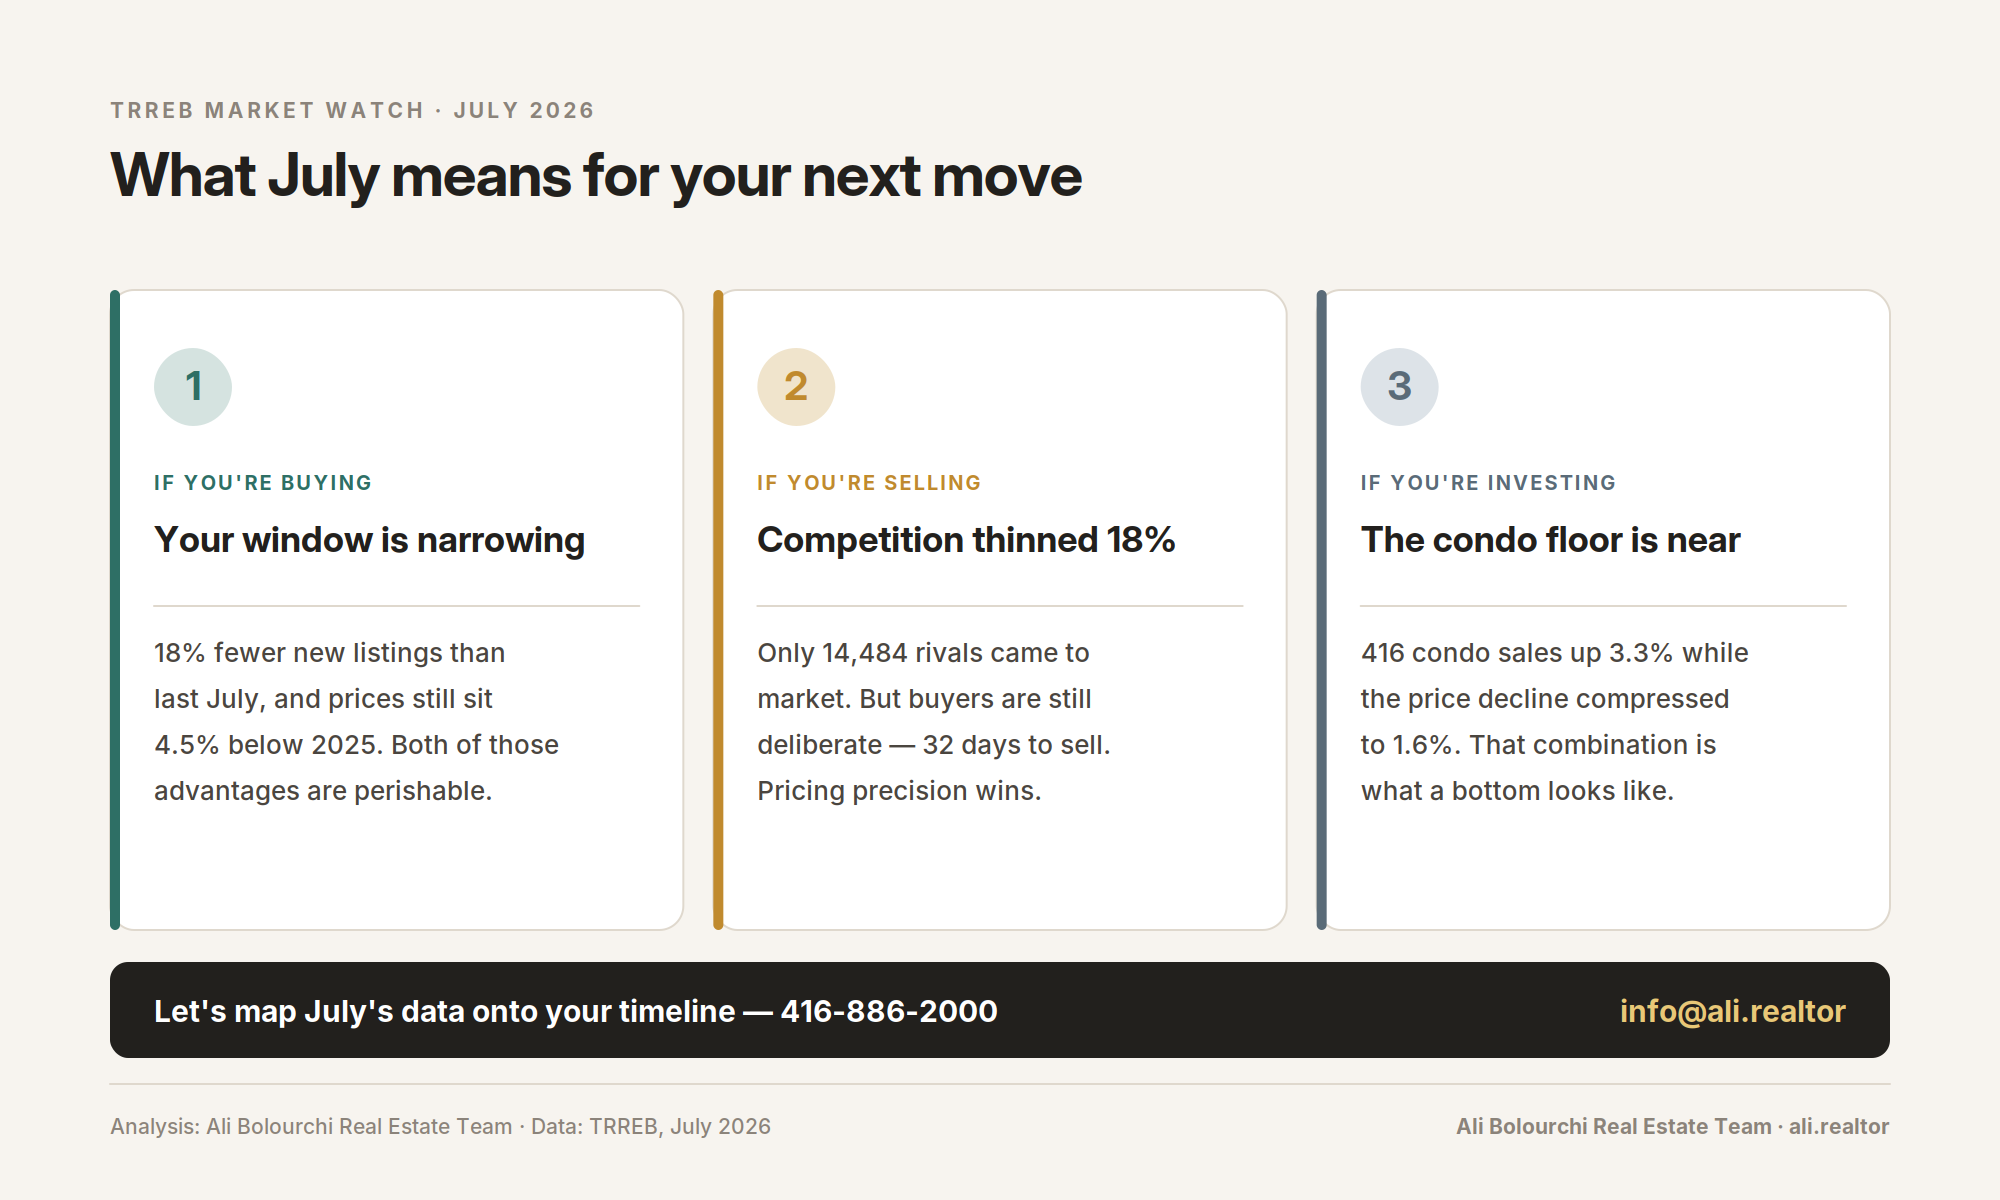
The window is closing — not slammed shut, but closing. With 18% fewer new listings and a sales-to-new-listings ratio at 41.4%, the leverage you had last summer is measurably reduced. Prices are still 4.5% below last year; that discount and today's negotiating room are both perishable. Get pre-approved, define your target segment, and be ready to act decisively.
If You're Selling
July handed you the best competitive setup in years: 17.8% fewer rival listings. But note the days-on-market figures — 32 days listed, 45 days total on market — buyers are still deliberate. Well-prepared, correctly priced homes are winning; aspirational pricing still sits. Strategy, staging and pricing precision matter more than ever.
If You're Investing
The condo data is doing the talking: rising 416 sales volumes with price declines compressed to 1.6%. Rental fundamentals remain supported by an average price point ($672,807 in the 416) that keeps ownership out of reach for many tenants. For a 3–5 year horizon, this remains an accumulation phase.
Where does July's data leave your plans?
Every market shift creates winners and waiters. Let's talk about which side of that line your strategy puts you on — with numbers specific to your neighbourhood, property type and timeline.
.png)